– Oh no! My WebServer ran out of memory!
I just returned from vacation, and while I was away, one of my friends messaged me, alerting me that my blog was down! He suspected that the web server might have been attacked by hackers and taken offline. Naturally, I felt a little panicked, but since I was on vacation, I decided to set the issue aside momentarily. Now that I’m back, I’ve discovered the real culprit – it seems I ran out of memory!
Initially, my first instinct was to increase the memory size temporarily and sweep the problem under the rug. However, upon closer inspection (and if you’ve read my previous post, you’ll see why), I realized that I hadn’t set up any swap file on my server. For those familiar with swap files, you know how crucial they are for improving memory usage.
So let’s setup our swap file. For this example let’s create one with 2GB (128 MB x 16):
$ sudo dd if=/dev/zero of=/swapfile bs=128M count=16Update and the read and write permissions for the swap file:
$ sudo chmod 600 /swapfileSet up a Linux Swap Area
$ sudo mkswap /swapfileLet’s make the swap file available for immediate use by adding it to the swap space:
$ sudo swapon /swapfileCheck if it was successfull by running the following:
$ sudo swapon -sNow we should have the swap ready, but if we restart the server it will not be used. So let’s configure it in the server fstab. Open the fstab file:
$ sudo vim /etc/fstabAnd add the following line at the end of the file, save and exit:
/swapfile swap swap defaults 0 0– Great! One less issue to be taken care of, but…
Thankfully, this time, my friend caught the issue with my blog being down. But relying solely on his vigilance isn’t a sustainable solution. I mean, hiring him as a server watchdog might sound amusing, but it’s not the most practical idea! 😜 Luckily, AWS has a solution for this – AWS CloudWatch Alarms.
With AWS CloudWatch Alarms, we can set up alerts based on metrics provided by a CloudWatch Agent, such as memory usage. When a specified threshold is crossed, it triggers an alarm, and voila! We receive notifications via email, ensuring we stay on top of any issues proactively. It’s like having a digital watchdog keeping an eye on things for us 24/7.
Before we dive into setting up AWS CloudWatch Alarms, there’s a crucial step: installing the CloudWatch agent on our server. Fortunately, the memory usage metric is registered by default, but we need the agent to collect and send this data to CloudWatch. For this example, we’ll use the server we previously deployed on Amazon Linux 2. However, it’s worth noting that the CloudWatch agent is compatible with other operating systems too.
Check out this guide for detailed instructions on installing the CloudWatch agent and configuring it to monitor your server’s metrics. Once that’s done, we’ll be ready to set up our CloudWatch Alarms and keep a close watch on our server’s performance. Let’s get started!
To write the metrics into the Cloudwatch we need to give the instance permissions for it, so first let’s add the cloudwatch agent policy to the role attached to the instance:

Now download the cloudwatch agent package and installed it:
$ wget https://amazoncloudwatch-agent.s3.amazonaws.com/amazon_linux/amd64/latest/amazon-cloudwatch-agent.rpm
$ sudo rpm -U ./amazon-cloudwatch-agent.rpm
To configure the Cloudwatch Agent run the wizard, and follow it according to your preferences, if you want to know more about it you read this AWS Document.
Just make sure to enable memory monitoring when asked:
$ sudo /opt/aws/amazon-cloudwatch-agent/bin/amazon-cloudwatch-agent-config-wizard
Then start the Agent using the configuration that was provided. The wizard created the configuration file in /opt/aws/amazon-cloudwatch-agent/bin/config.json
$ sudo /opt/aws/amazon-cloudwatch-agent/bin/amazon-cloudwatch-agent-ctl -a fetch-config -m ec2 -s -c file:/opt/aws/amazon-cloudwatch-agent/bin/config.jsonIf everything went fine the Agent should be running and we should see in Cloudwatch some metrics:

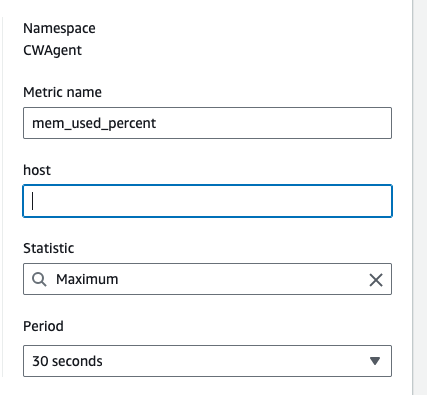
Confirm if you have the “mem_used_percent” metric and create a alarm from it:

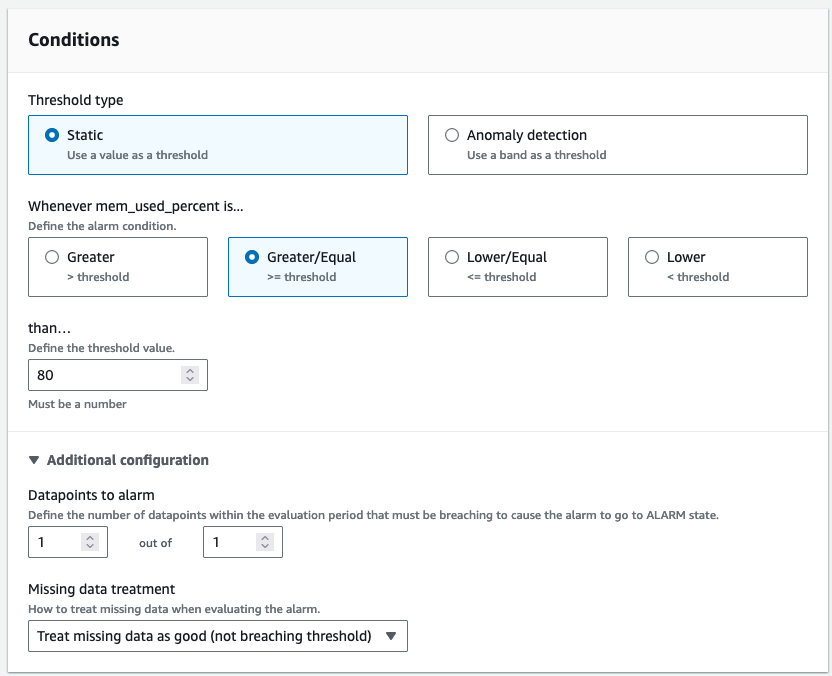
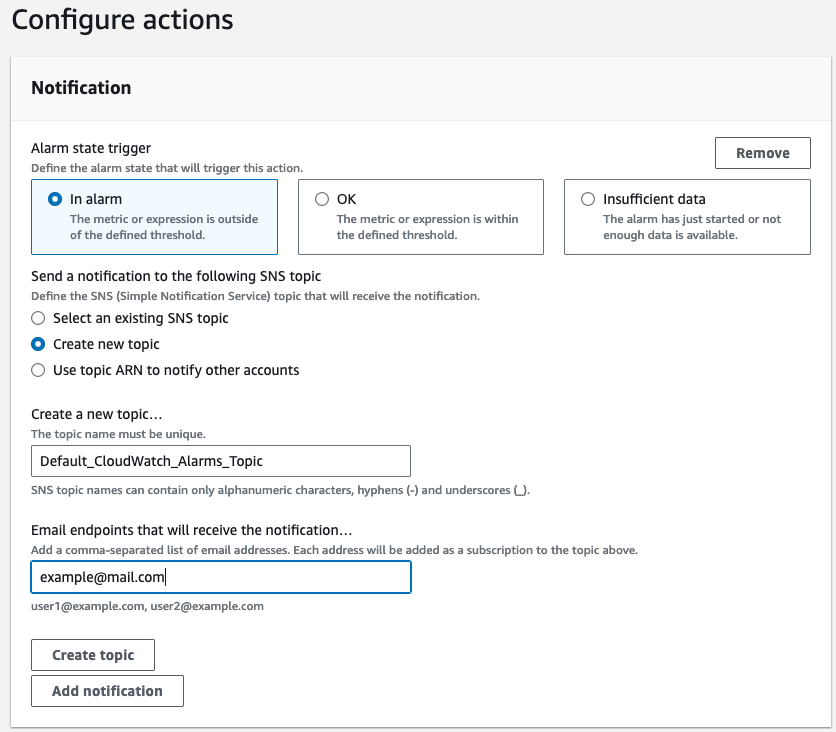
In the alarm creation, setup according to your preferences. For example, let’s create and alarm when the Max memory peaks at 80% sends a email to [email protected]


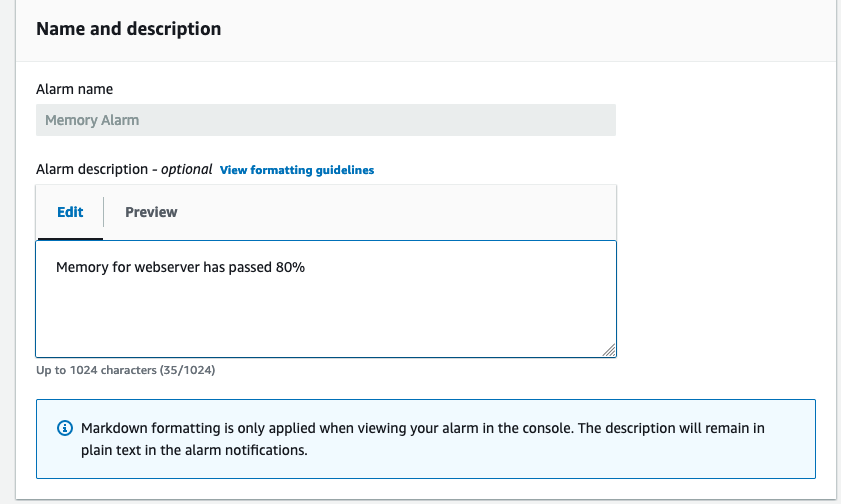
Give it a name and a description

And the alarm is created! Don’t forget to accept the topic subscription in the email:

With this, AWS will notify by email if the server is ever close to run out of memory and we can act on it before anything happens. Of course we can setup Alarm actions to automatically perform some action action like a auto scaling action but we can leave that for another blog post 😉.
What do you think? Leave a comment of your thoughts!


Great to see your thong process. Not only getting the solutions, but seeing the problems, the way you approach the problem with the solutions is very fruitful.
Keep up the good blog posts quality.
Maybe I setup a DDoS attack on your machine to see you write about WAF next time 😅
More blog content for me to write ehehe!
Esquece, tá? Isso aqui é elite!
You nail in every single aspect – it’s fun to read, rich in tech details and tells a story. Please keep writing!
ahaha obrigado!
More posts coming soon 🙂